A high-probability pick on a low-volume stock is a trap. The model can be right about the recovery and you can still lose, because a thinly traded stock will not fill your orders at the prices you set. Average volume is not a detail. In dividend capture, it is the difference between a clean exit and a position you cannot get out of.
Why Volume Matters More in Dividend Capture Than in Investing
A buy-and-hold investor barely thinks about volume. They buy once, sit for years, and sell whenever they feel like it. If the spread costs them a few cents, it disappears into a decade of holding. Liquidity is a rounding error.
Dividend capture is the opposite. You buy today, you sell tomorrow, and you need a specific price on the way out. Your whole edge depends on getting filled at your take-profit (TP) level, or being protected at your stop-loss (SL) level, inside a narrow window. That makes you completely dependent on there being real buyers and sellers sitting at the prices you care about. If they are not there, your plan does not execute, no matter how good the prediction was.
So the probability of recovery is only half the question. The other half is: if the price gets to my level, will my order actually fill? On a liquid stock the answer is almost always yes. On a thin one, the answer is often no, and that "no" is where dividend capture traders quietly bleed.
The Chart Lies About Your Fill (Here Is Why)
This is the single most important thing to understand, and almost nobody explains it properly.
The candlestick chart you look at plots the last traded price. Your limit order does not fill against the last traded price. It fills against the bid and the ask, the two live queues of buyers and sellers. On a liquid stock those three numbers sit almost on top of each other, so the chart is a realistic picture of what you can actually trade at. On a thin stock they drift far apart, and the chart stops telling you the truth about your own order.
Walk through the two cases that ruin trades:
A sell limit only fills when the BID rises to your price.
On the chart you see one green candle spike up and "touch" even surpasses your TP.
But that was a single small trade at the ASK. The BID never got there.
Result: the prediction looks correct on the chart, your order stays open.
Your stop (SL):
A sell stop needs a real buyer at or near your stop price to take you out.
On a thin stock there may be no buyer there at all.
Result: either you do not get filled and the loss keeps growing,
or you slip far below your stop and exit much worse than planned.
This is why you can sit there watching the price print above your target, refreshing the screen, and your TP order just will not trigger. The print was real. It was one trade, with nothing behind it. There was no depth at your price, so your order kept waiting. The thinner the stock, the wider that gap between what the chart shows and what you can actually get.
The reason is mechanical, not bad luck. Spread width is set by volume: heavy trading pulls the bid and ask tight together, thin trading lets them spread wide apart. A wide spread is the market telling you, in advance, that your fills will be unreliable.
What Volume Numbers Actually Mean
"Average volume" usually means average daily volume (ADV): the number of shares traded per day, averaged over a recent window (commonly 20 or 50 days). It is your baseline for how active a stock normally is, and it is the fastest single read on whether you can trade something safely.
Here is a practical map for dividend capture, where you need a reliable round trip inside one to two days:
| Average Daily Volume | Verdict for Dividend Capture | What You Will Experience |
|---|---|---|
| Under 100,000 | Avoid | Illiquid for almost any active strategy. Wide spreads, frequent unfilled orders, violent moves on small trades. High risk regardless of how good the pick looks. |
| 100,000 - 500,000 | High caution | Workable only with small positions and a lot of patience. Expect partial fills, slow fills, and slippage. Your TP may never trigger even when the chart says it should. |
| 500,000 - 1,000,000 | Acceptable | Generally fine for typical retail dividend capture sizes. Spreads are usually tight and your orders behave close to plan. |
| Over 1,000,000 | Ideal | Tight spreads, fast and full fills, your TP and SL do what you told them to do. This is where you want to be living. |
These are the same liquidity floors active traders use everywhere: roughly 500,000 shares as a day-trading minimum, with anything under 100,000 treated as illiquid. They are heuristics, not laws, but they are battle-tested for exactly the problem you have: getting in and out cleanly in a short window.
You can find volume information and other useful details in the detail pages of each Instrument and Dividend.
Share Volume Can Fool You: Check Dollar Volume Too
Half a million shares of a $4 stock is only $2 million of trading. Half a million shares of a $200 stock is $100 million. Same share count, completely different liquidity. The cleaner measure is dollar volume:
Example A: 500,000 shares x $4 = $2,000,000 (thin in dollar terms)
Example B: 500,000 shares x $200 = $100,000,000 (very liquid)
Rule of thumb: the cheaper the stock, the more shares of ADV you want
before you trust your fills.
If you only ever look at one extra number beyond the share count, make it dollar volume. It catches the cheap, thin names that share volume alone makes look safer than they are.
So What Is a Good or Bad Dollar Volume?
Here is the same kind of map as before, but in dollars traded per day. This is the number that actually decides whether the order book is deep enough to take you in and out, so when it disagrees with the share count, trust the dollars.
| Daily Dollar Volume (ADV x price) | Verdict for Dividend Capture | What You Will Experience |
|---|---|---|
| Under $1 million | Avoid | Barely trading. Prints arrive minutes apart, the bid and ask sit far away from the last price, and your orders wait on buyers who are not there. This is the 1,000,000 shares at $1 case: $1,000,000 of flow, and you can watch a single candle take 15 to 30 minutes to finish forming. |
| $1 million - $5 million | High caution | Still thin in dollar terms. A $4 stock at 500,000 shares is only $2 million, which looks fine on share count and trades badly. Small size and patience only, and expect partial or slow fills. |
| $5 million - $25 million | Acceptable | Generally fine for typical retail capture sizes. Prints stream continuously, the spread is usually tight, and your TP and SL behave close to plan. |
| Over $25 million | Ideal | Deep book on both sides. Fast, full fills at the price you set. The $100 million example from above lives comfortably up here. |
A simple rule of thumb, no calculation needed: watch how often new candles print. On a stock with healthy dollar volume the bars update every second or two because trades are constantly happening. On a thin one you will literally sit and watch a one-minute candle take 15 to 30 minutes to close, because almost nothing is trading. If the chart feels frozen, the dollar volume is too low, whatever the share count says. That is a red flag for dividend capture, skip signal.
Three Real Examples: Liquid, Medium and Thin
Theory is one thing. Here are three real stocks at three different liquidity levels, so you can see what each tier actually looks like before you trade it. For each one there are two screenshots: the intraday chart, which tells you how often the stock genuinely trades, and the same stock on its detail page, where we color the $ volume figure by tier so you get the verdict at a glance (green is ideal, blue acceptable, amber caution, red avoid).
Liquid: NYSE:PR
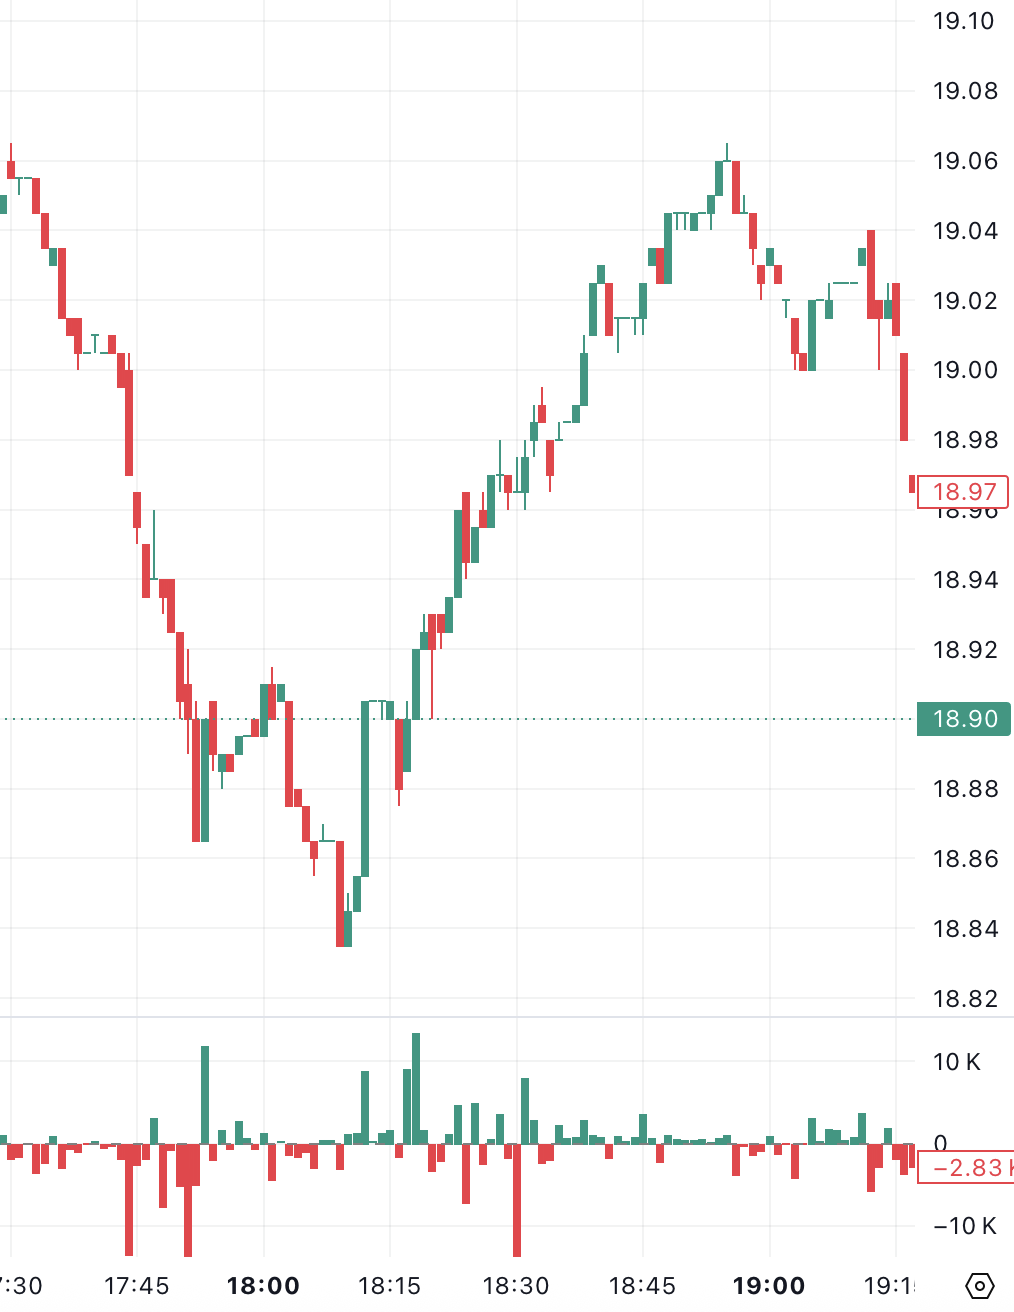
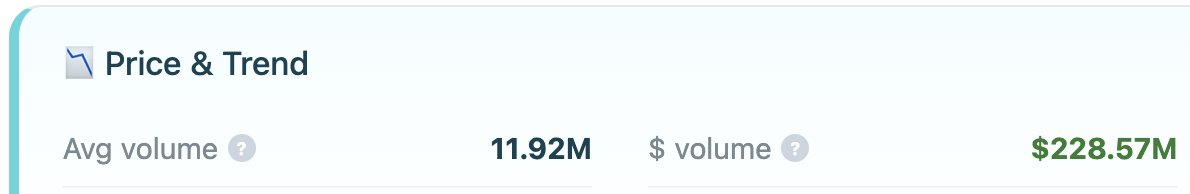
At roughly $229 million of dollar volume, PR sits deep in the green tier, and the chart shows why: a complete candle prints every single minute because trades arrive constantly. On a stock like this your limit order fills at the price you set, and your stop has real buyers sitting behind it. This is the liquidity you want for a clean one to two day capture, the price on the chart is the price you can actually trade at.
Medium: NASDAQ:OCS
OCS at about $22 million lands in the blue, acceptable tier. The stock genuinely trades, there is a candle most minutes, but the thin bodies and gaps tell you there is less depth at any given price. Expect the occasional partial fill or a little slippage on the way out. It is tradable for typical retail size as long as you stay realistic about fills and keep your order small relative to the daily flow.
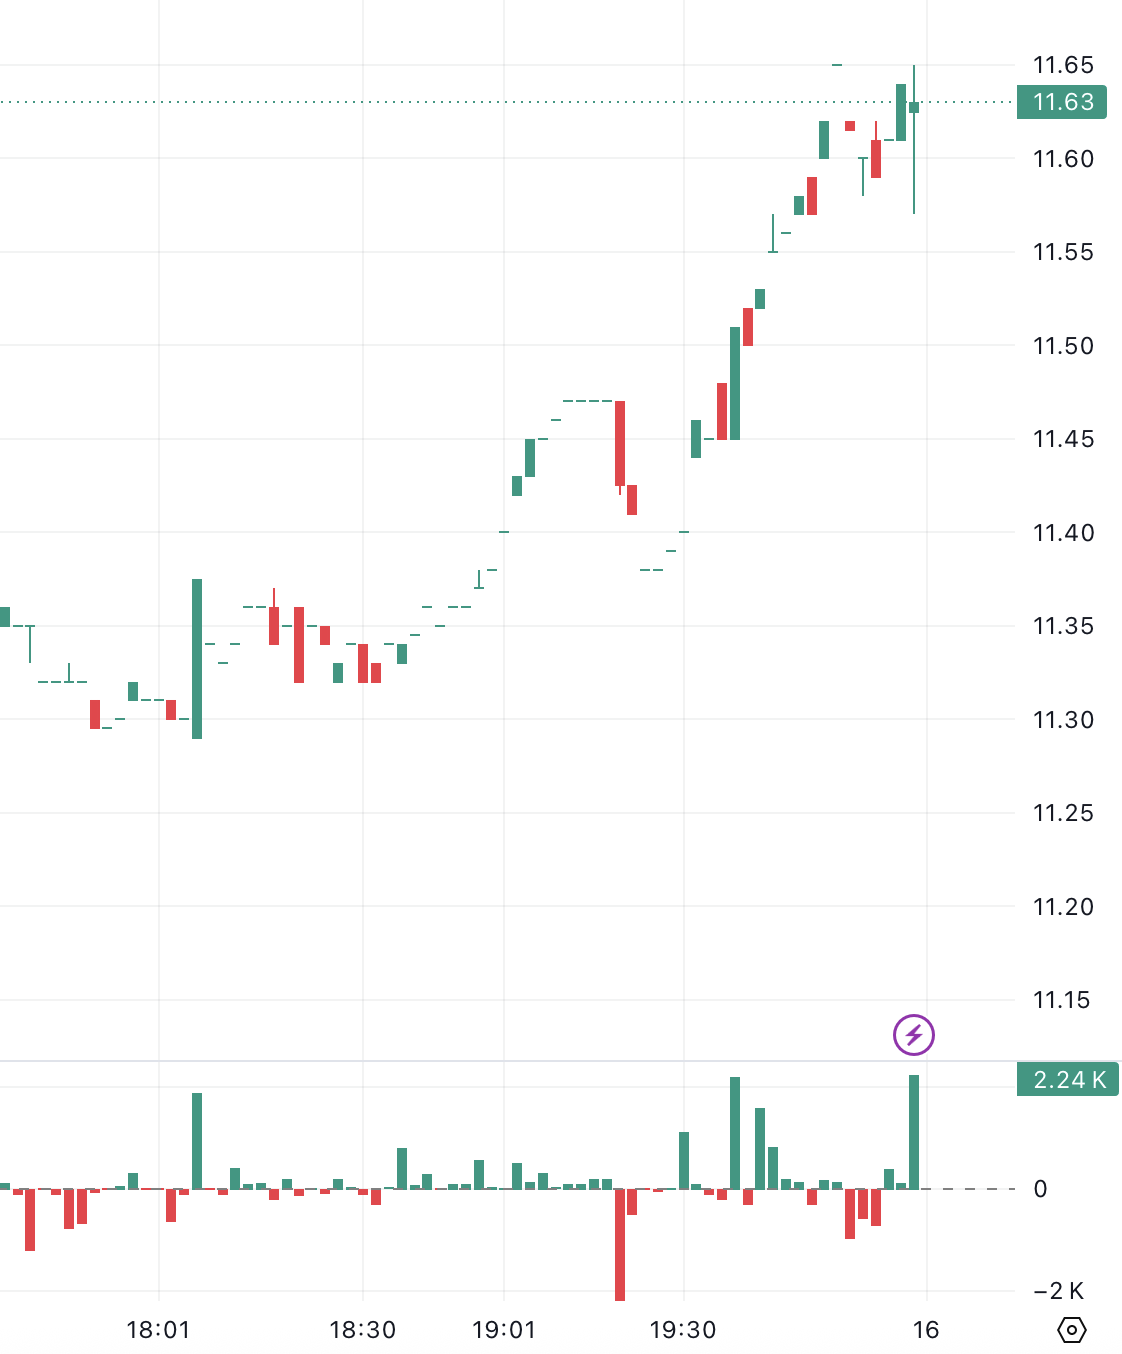
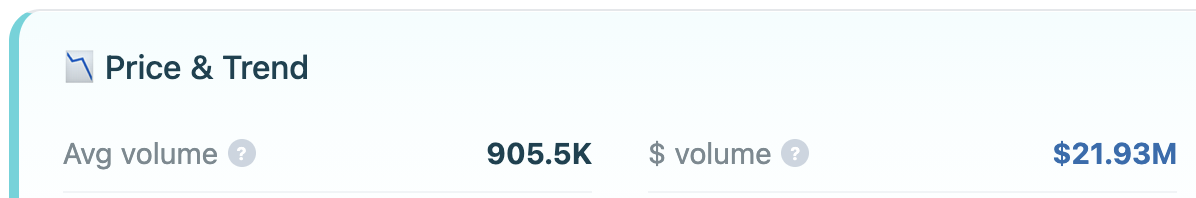
Thin: AMEX:SACH
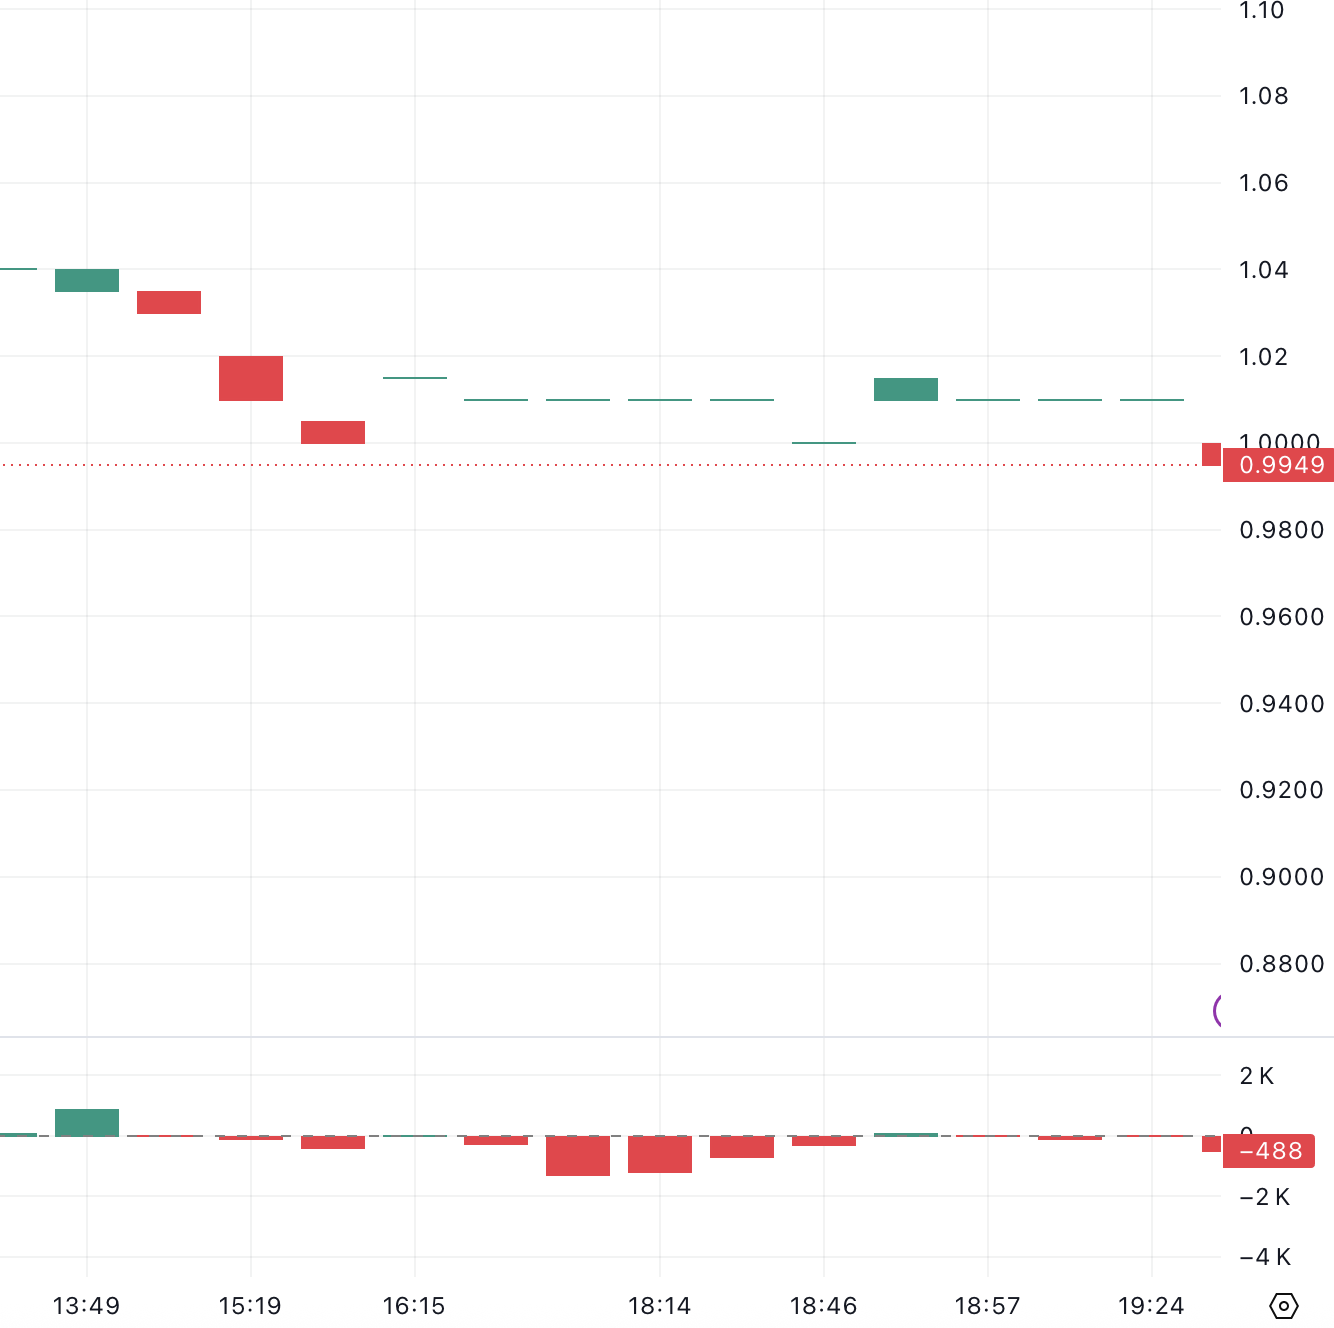
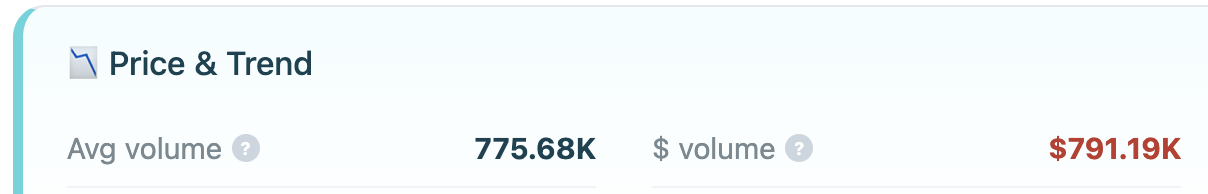
This is the trap, and it is worth looking at closely. SACH trades 775K shares a day, almost the same share count as OCS's 905K. On share volume alone the two look like the same kind of stock. But SACH costs about a dollar, so that activity is only $791K of dollar volume, deep in the red tier. The chart gives the game away: a candle completes only every 5 to 15 minutes, because whole minutes pass with no trade at all. On a stock like this your take-profit can sit unfilled while the printed price floats above it, and your stop may have no buyer when you need one. Same share count as OCS, completely different stock to trade. This is exactly the cheap, thin name that dollar volume is built to catch.
The Two Ways Low Volume Costs You Money
It is worth separating the two failure modes, because they hurt differently and people only ever remember the first one.
1. Your take-profit never fills (missed gains, forced bad exit)
The recovery happens, the chart prints through your target, but your sell limit sits unfilled because there is no real bid at your price. Now the clock is running. You are holding past your intended exit, and the longer you wait, the more likely the price drifts back down. Often you end up dumping the position near the close at a worse price just to be flat. The prediction was correct. You did not get paid for it.
2. Your stop-loss fails or slips badly (uncapped losses)
This is the dangerous one. A stop only protects you if there is a buyer waiting near your stop price. On a thin stock, there often is not. The price can gap straight through your level with nothing in between, so you either do not get filled at all and the loss keeps growing, or you get filled far below your stop. The protection you thought you had was an illusion the whole time.
Put those together and the asymmetry is brutal: on a low-volume stock your upside is capped by orders that will not fill, while your downside is uncapped by stops that will not hold. That is the exact opposite of what you want from a trade.
Volume Sets the Ceiling on Your Position Size
Even a decent-volume stock becomes dangerous if your order is large relative to its daily flow. A widely used guardrail among active traders is to keep any single order under roughly 1% of average daily volume. Push past that and you start moving the price against yourself, which is the worst time to discover you are the biggest participant in the stock.
ADV = 1,000,000 shares -> keep orders under ~10,000 shares
ADV = 200,000 shares -> keep orders under ~2,000 shares
In dividend capture you deploy your full account into one name at a time,
so as your capital grows, low-volume stocks quietly fall out of reach.
A $20,000 account simply cannot trade a thin stock without becoming the market.
The practical takeaway: liquidity is not just a yes/no gate, it scales with your account. A volume level that is fine for a $500 account can be completely unworkable for a $20,000 one. The bigger you get, the more ruthlessly you should filter for volume. For the mechanics of sizing each trade, see Position Sizing: How Much to Invest in Each Dividend Trade, and for setting exits that actually hold, see Exit Strategy: The Critical Difference Between Winners and Losers.
How DividendHunting Handles Volume For You
This is exactly why volume is built into how the Pick of the Day is chosen. A pick is never selected on recovery probability alone. Stocks with the lowest dollar x volume are discarded before they ever reach the shortlist, because a high-probability pick you cannot trade cleanly is not a good pick, it is a liability. We would rather skip a name than hand you one where your TP and SL are unreliable.
You do not have to take that on trust, and you should not. Here at Dividend Hunting, for each instrument and for each individual Dividend Event, we display its average volume and dollar x volume on the Stock and ETF screeners and Dividend Calendar detail pages. This way you can check liquidity yourself before you commit to any trade, including ones you find outside the daily pick. Make it part of your routine: confirm the probability, then confirm the volume. If the volume is thin, the probability does not matter. Pass and move on.
If you trade with a specific broker, narrowing the universe to what your broker actually supports also tends to strip out the most illiquid names automatically. See Watchlists: Why You Need One and How to Build It.
A Simple Pre-Trade Volume Check
Before you place any dividend capture trade, run this quick filter. It takes ten seconds and it removes the single most common reason good forecasts turn into bad trades.
2. Under 100,000 shares? Skip it. Full stop.
3. Dollar volume (ADV x price) healthy? Cheap stocks need more shares.
4. Is my order under ~1% of ADV? If not, size down or pass.
5. Is the spread tight right now? Wide spread = unreliable fills.
If any of these fail, the recovery probability does not save the trade.
A correct prediction on a stock you cannot trade is worth nothing. Volume is what turns a good pick into a good trade. Check the probability, then check the volume, every single time. When the volume is thin, walk away. There is another pick tomorrow.
This article is educational and is not financial advice. Liquidity conditions change, and past behaviour does not guarantee future fills. Always check current volume and spreads for yourself before trading, and consider your own risk tolerance and circumstances.
Frequently asked questions
Why does trading volume matter for dividend capture?
Because a high-probability pick on a thin stock is a trap: your order moves the price, your take-profit may not fill, and wide spreads eat the dividend. Liquidity decides whether you can get in and out at the prices you see.
Should I measure liquidity in shares or dollars?
Dollar volume, which is average daily volume times price, not share count. A cheap stock can show many shares yet trade very little money, which is where fills disappear.
How much volume is enough?
Favor names with ample daily dollar volume and keep your order a small fraction of it, roughly under 1 percent of average daily volume, so you do not move the price against yourself.

