Your own dividend-capture scoreboard. The Dividend Tracker turns your real trades into a clear running picture: how much capital you have, what dividends are still on the way, and what your true return looks like over time. Log a trade in a few seconds and the tracker does the rest of the maths for you.
What the Dividend Tracker is
It is a personal version of the dividend-capture spreadsheet many hunters already keep by hand, built straight into the site. You record each capture you make, and the tracker keeps score: capital invested, dividends earned, dividends still pending, profit and loss on the share price, and your overall return. Think of it as a logbook that also adds everything up correctly, including the parts most spreadsheets get wrong.
Logging a movement
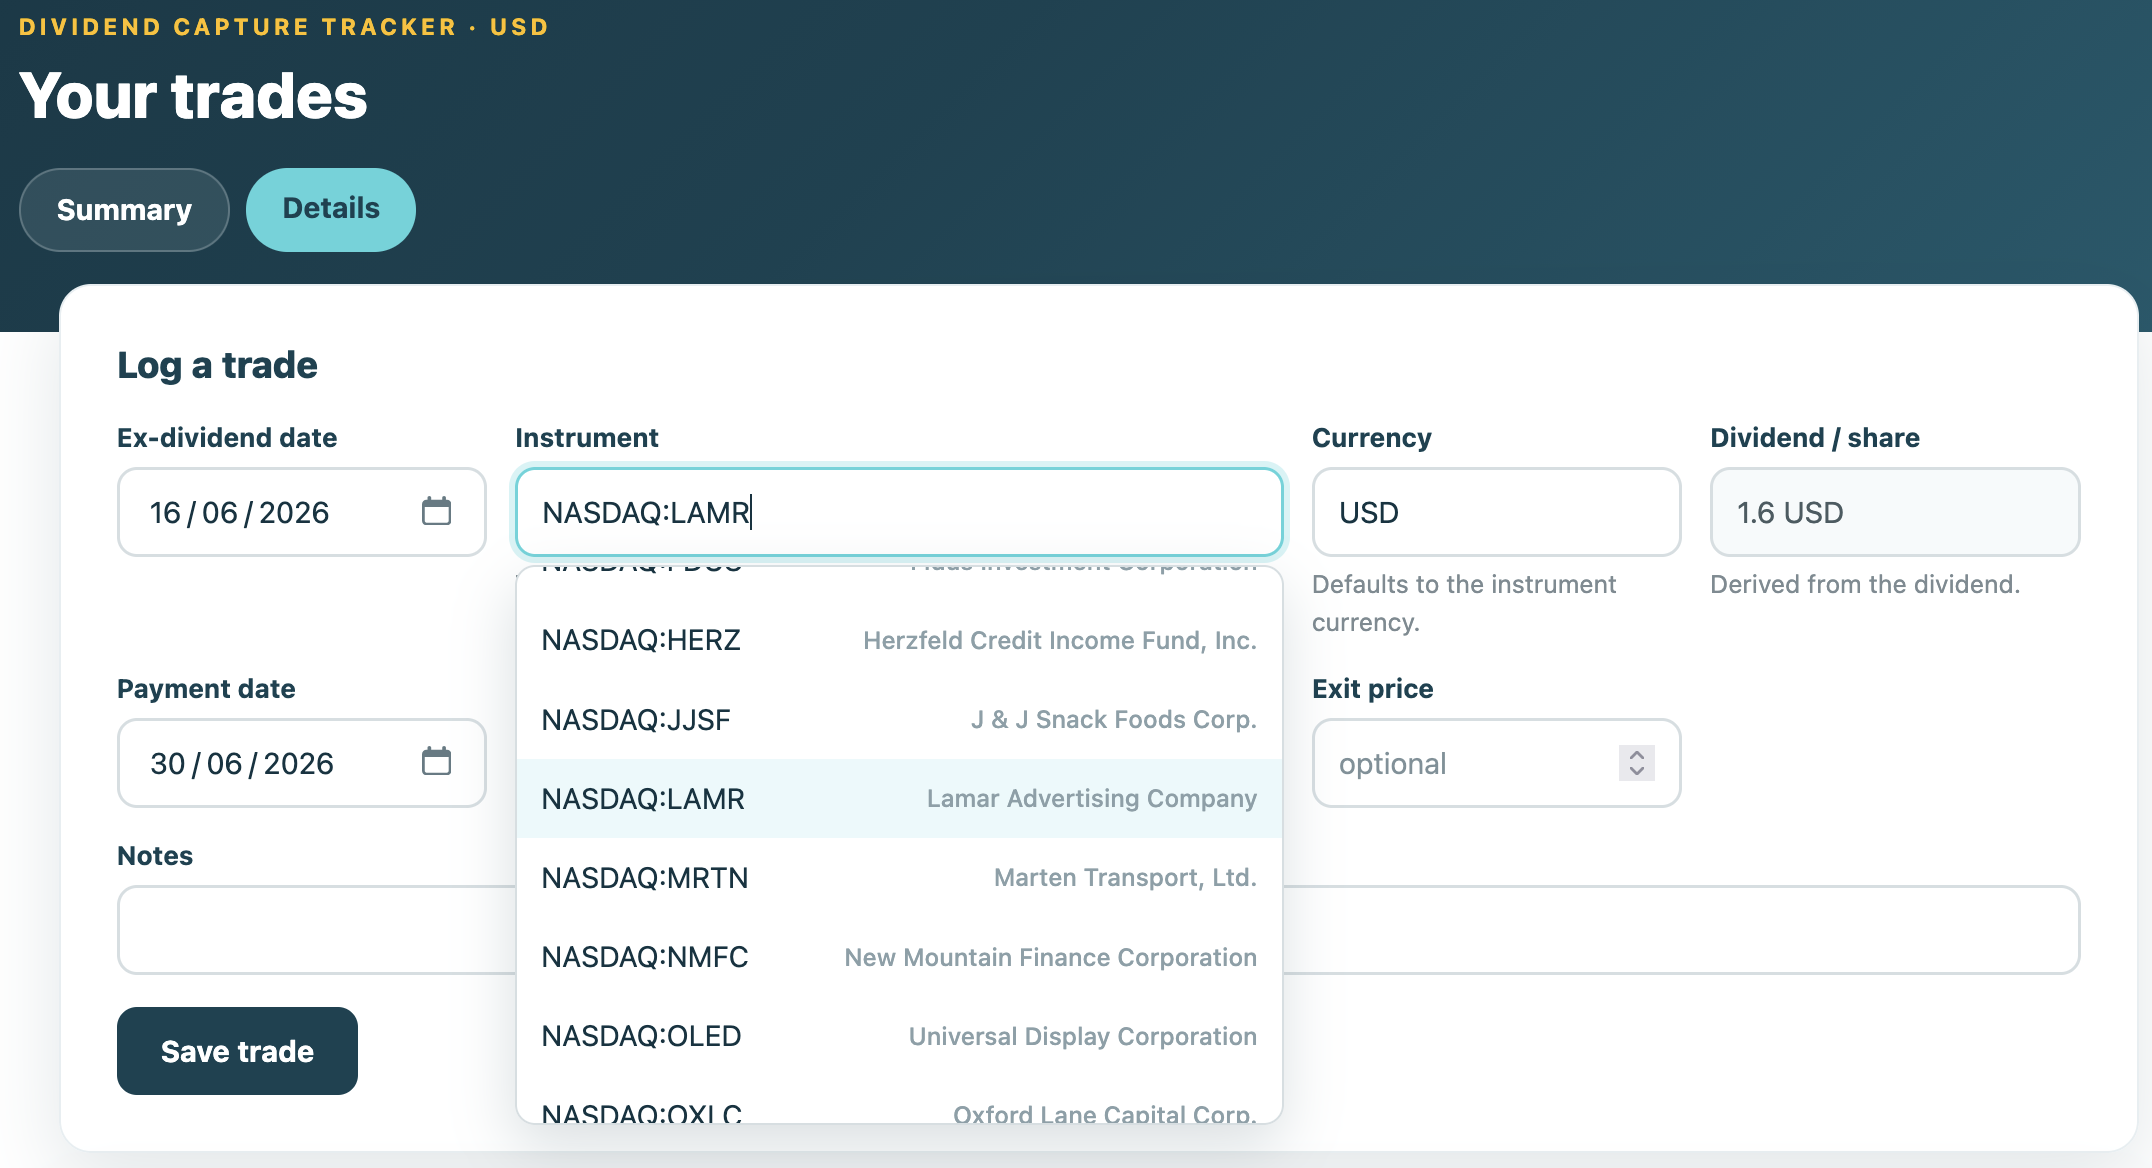
Adding a trade is quick. You pick the ex-dividend date, then choose the instrument from a list of names that actually go ex-dividend that day, so you are never guessing tickers. The tracker fills in the dividend per share and the payment date for you. You add how many shares you bought, your entry price, and your exit price once you sell. That is it.
If you have not sold yet, leave the exit price empty. The trade stays open and the tracker still counts the dividend you are owed. Come back and add the sell price later, and every number updates on its own. You can edit any row at any time, and the whole history recalculates.
See your return and how it evolves
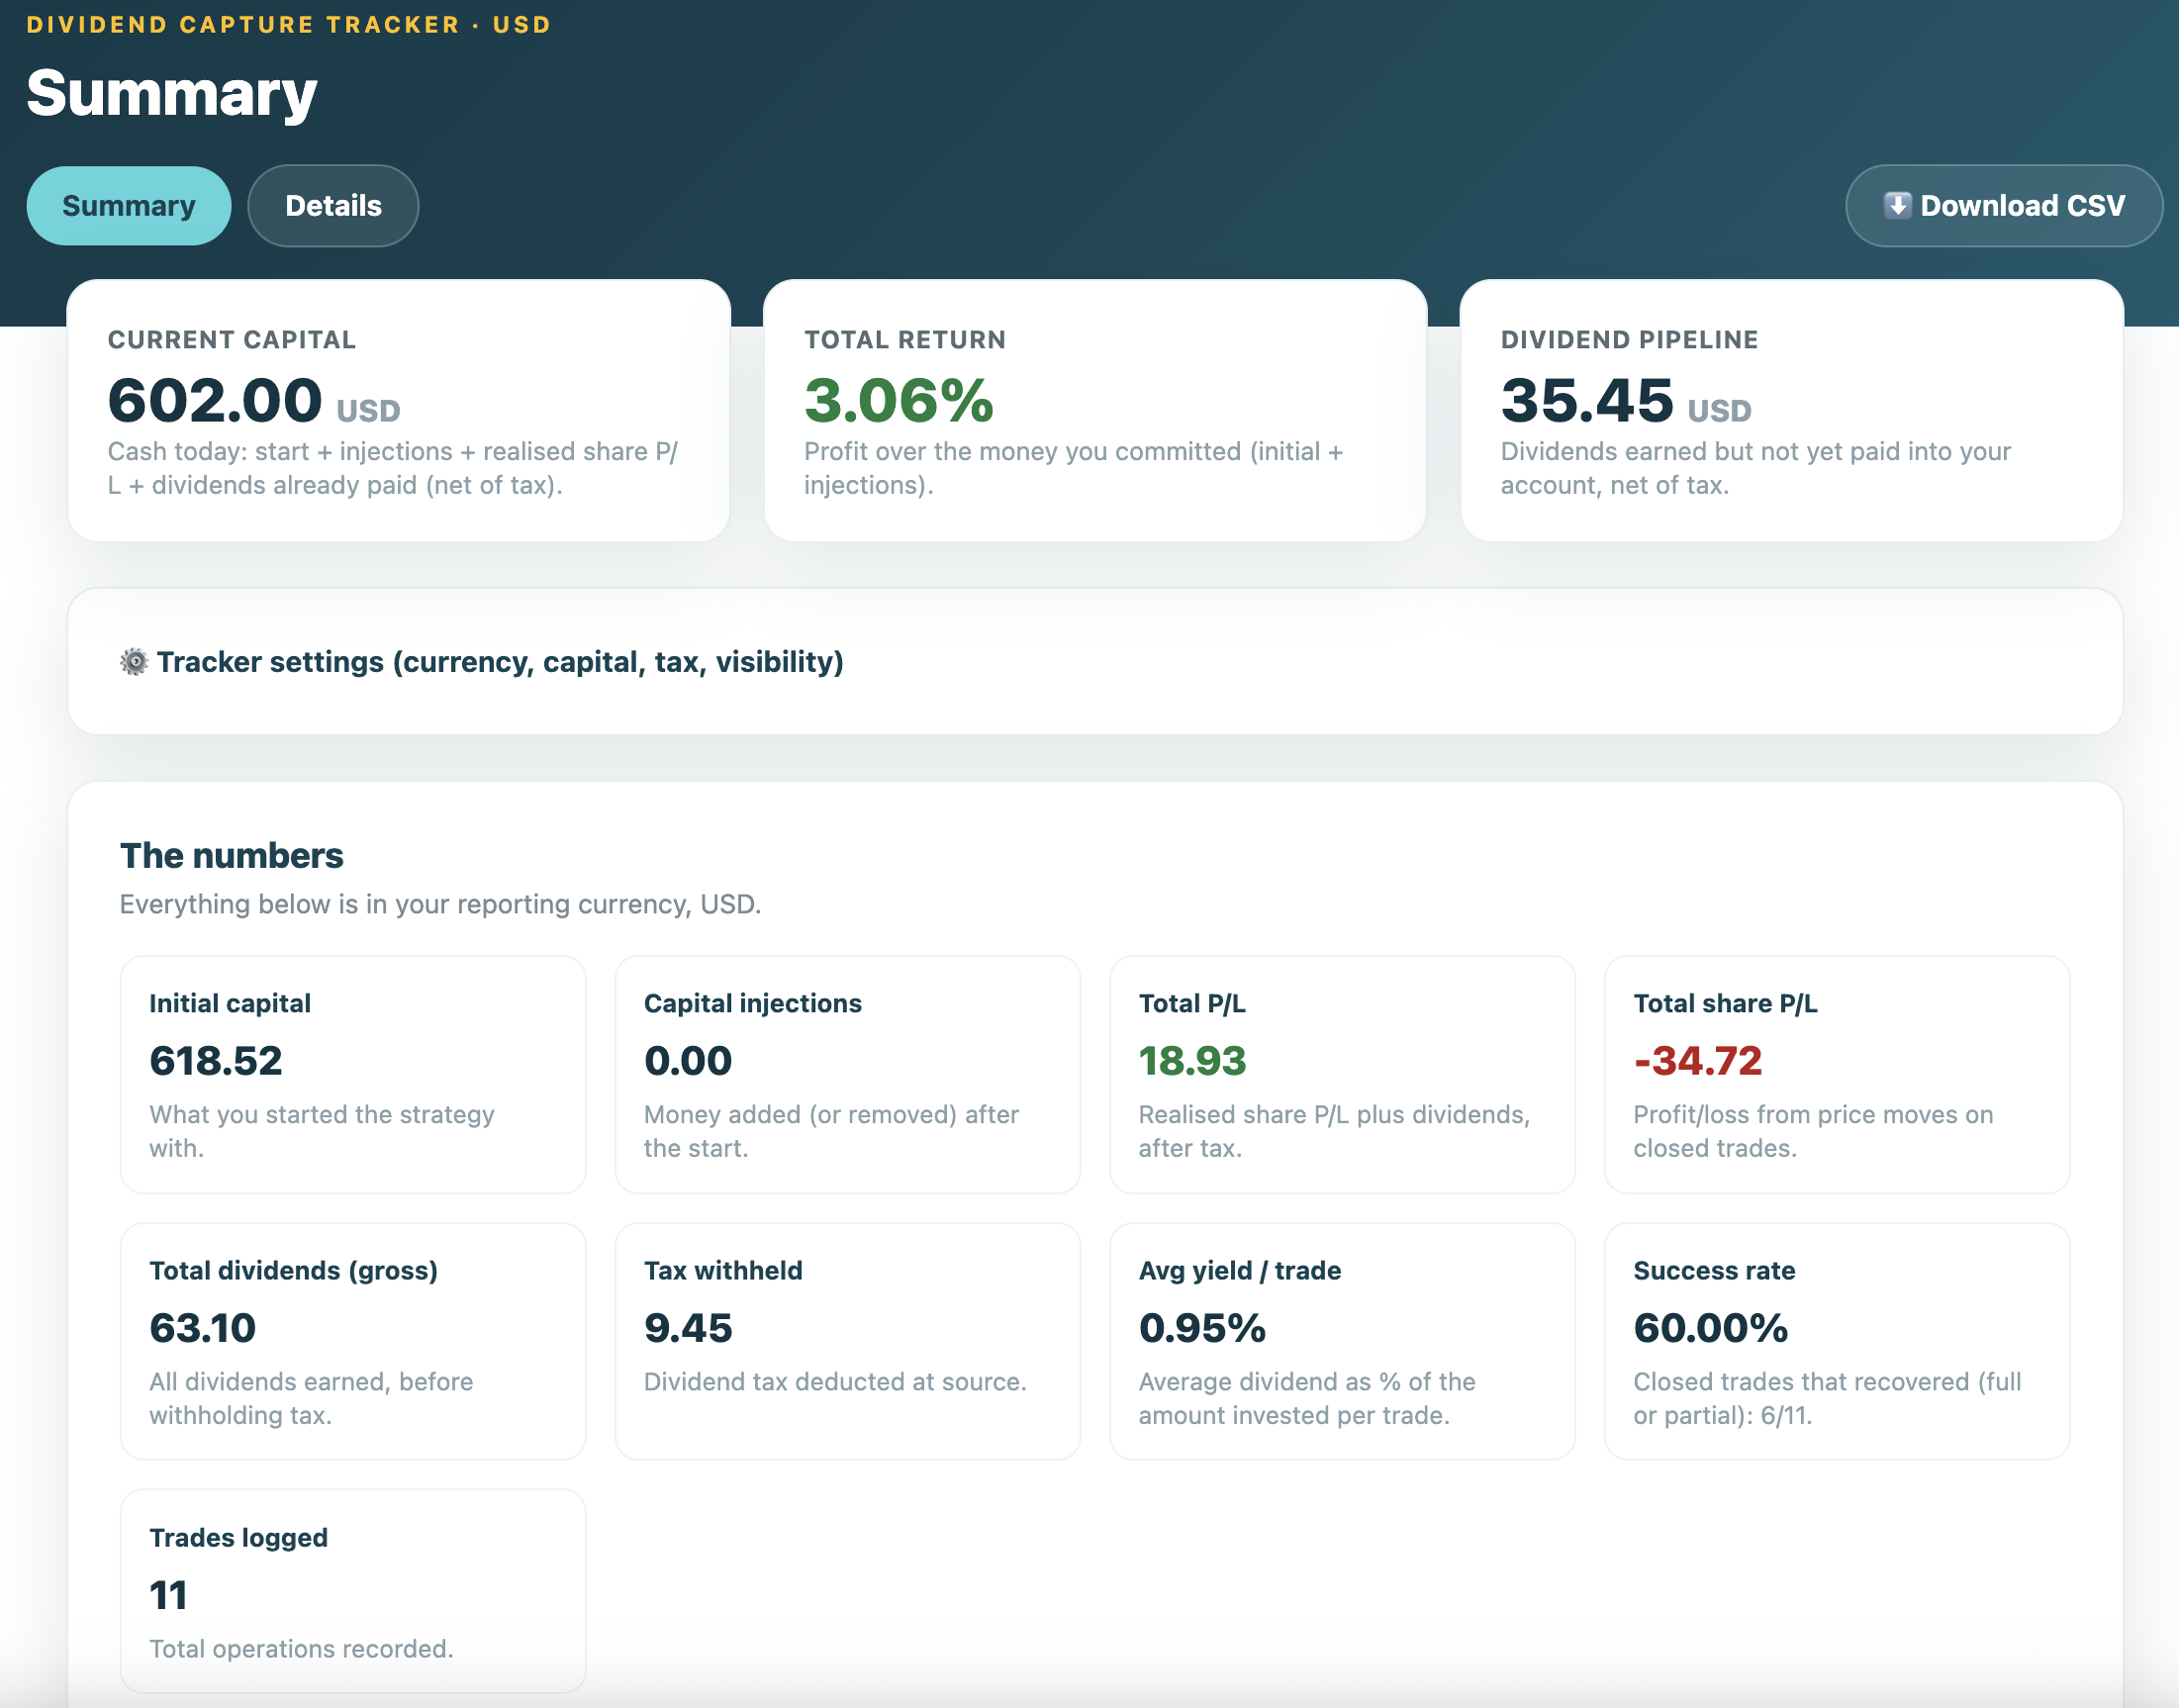
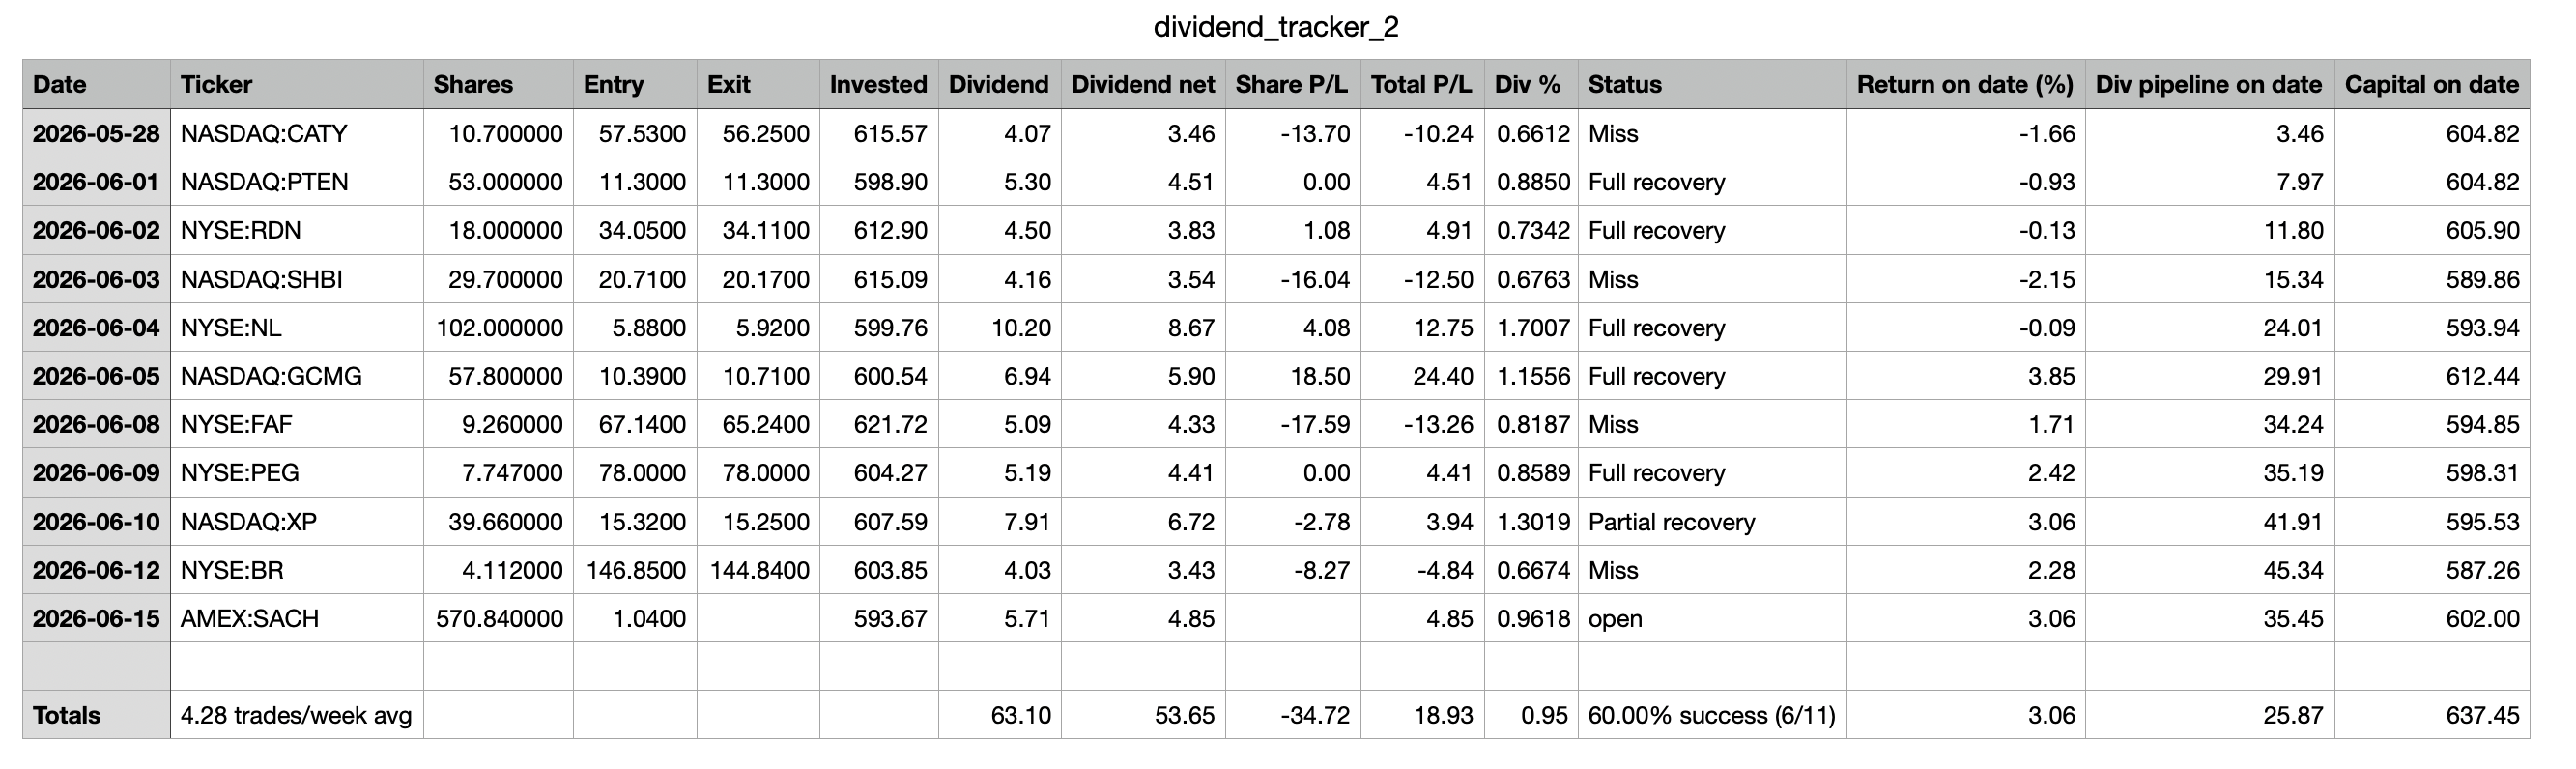
The Summary tab shows the figures that matter at a glance: your initial capital, your current capital, the dividends still in the pipeline, your total profit and loss, your average yield per trade, and your success rate. Each number has a short plain-language note so you always know what you are looking at.
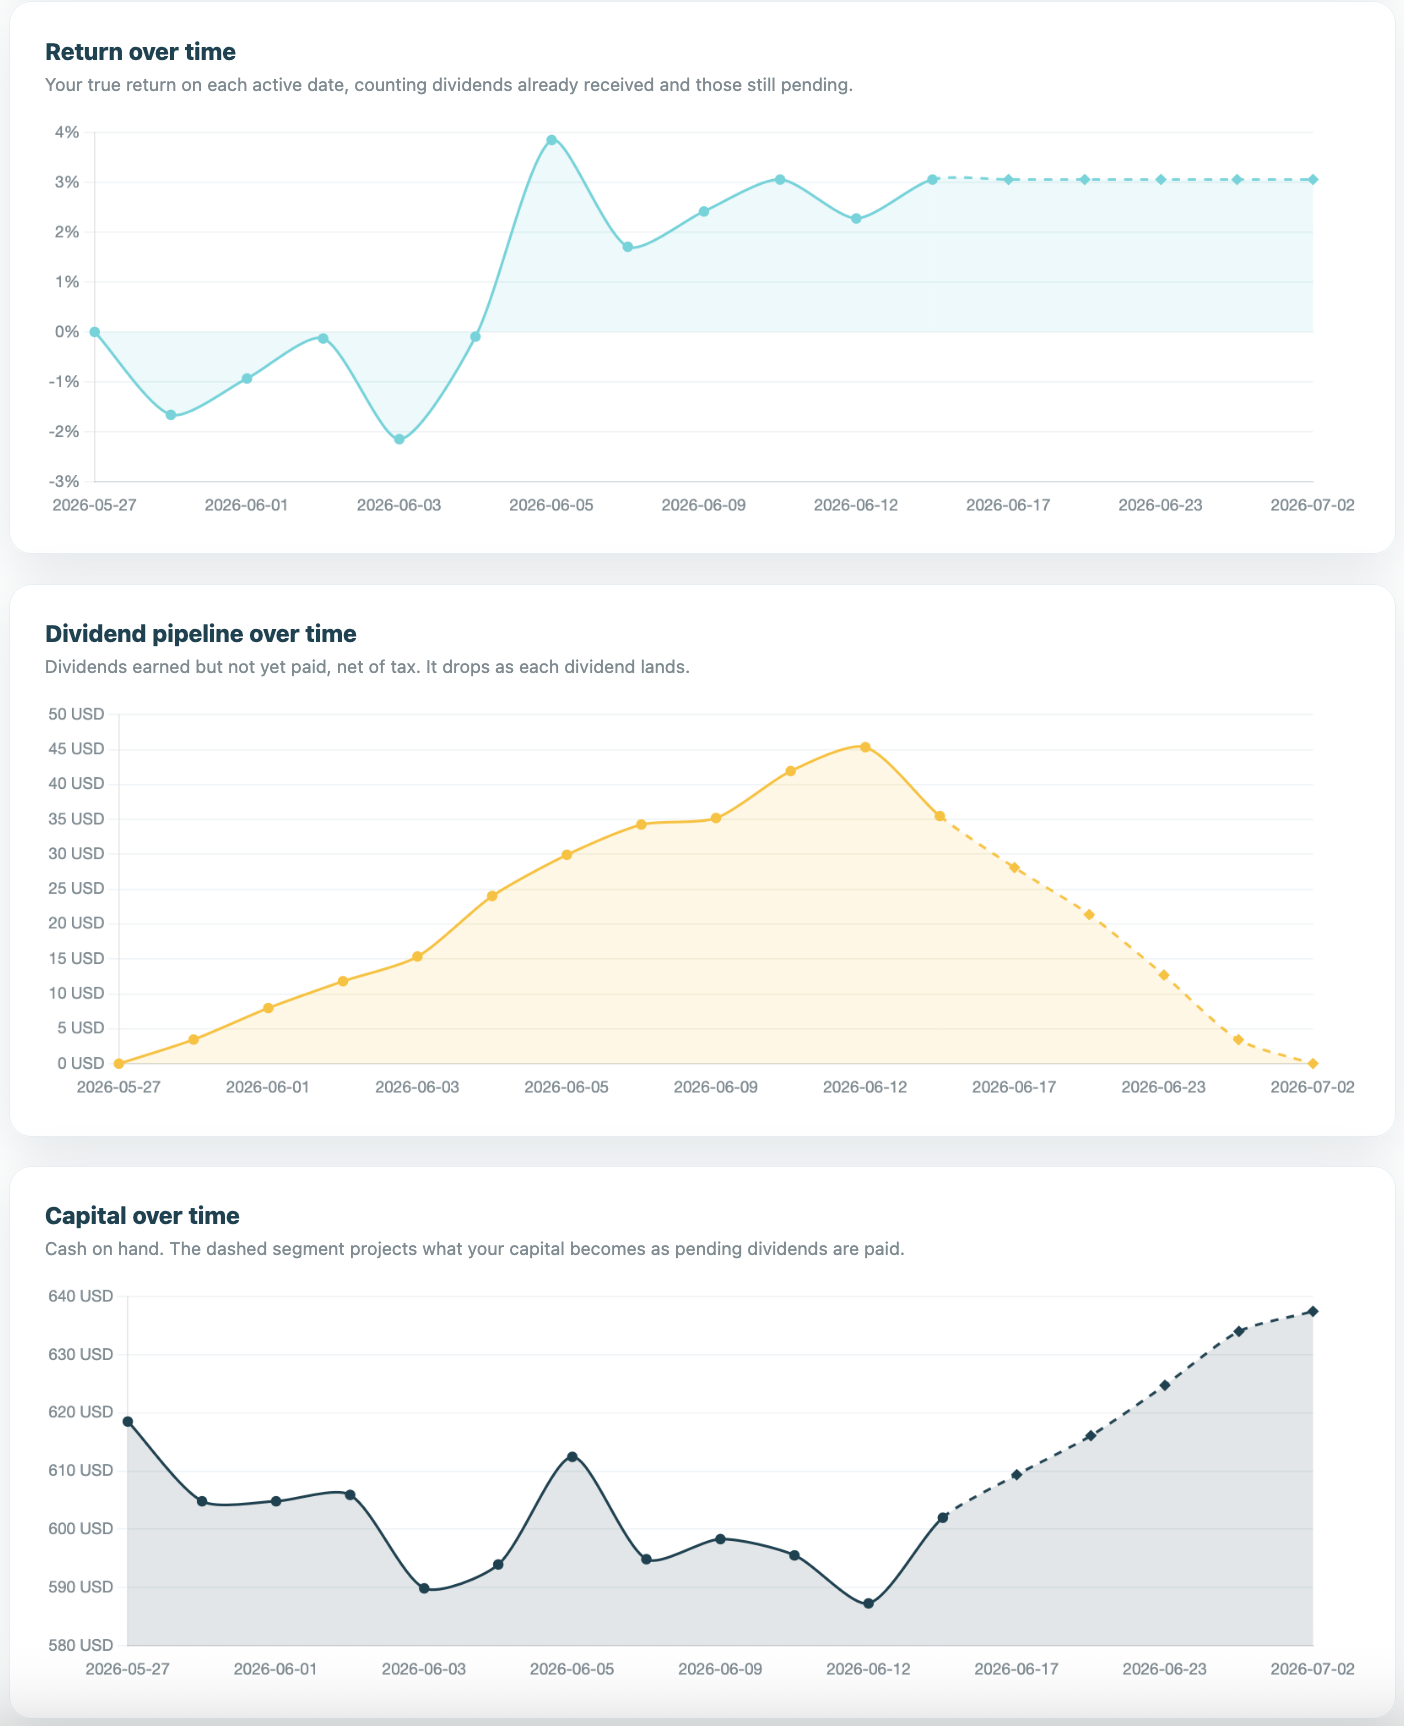
Below the numbers are three charts that tell the story over time:
- Return over time: your true return on every active day, counting both the dividends already received and those still pending.
- Dividend pipeline over time: how much dividend income is on its way, which falls each time a payment lands in your account.
- Capital over time: your cash balance, with a dashed line projecting where your capital is headed as the pending dividends get paid.
One thing worth knowing: the tracker counts a dividend as real income only once its payment date arrives, and it accounts for withholding tax if your broker deducts it. That gives you an honest return figure rather than an inflated one.
Your data is private by default
Your tracker belongs to you and to you alone. When you are logged in you only ever see your own tracker, never anyone else's, and no other user can see yours. Nothing you log is shared anywhere unless you decide to share it yourself. By default, every tracker starts private.
Sharing your track record, anonymously
If you are proud of your results, or just want to contribute to the community scoreboard, you can flip a single toggle in your tracker settings to make your record public. When you do, other registered hunters can view it, but only your trading is exposed. Your name, your email, and everything else about your profile stay hidden. You appear under an anonymous label such as "Hunter #1A2B", so people see how you trade without ever seeing who you are.
You stay in control. Turn the toggle off whenever you like and your record drops out of the public view again.
Export to CSV for your own records
You can download your entire history as a CSV file at any time. Every trade is there, with the running return, pipeline and capital on each date, plus a totals row at the bottom that sums up your performance. It is handy for keeping your own backup, and it can save you time at tax season when you need a clean list of your dividend income and your gains and losses for your annual return.
Who can use it
The personal Dividend Tracker is a Hunter feature. Logging your own trades, the charts, and the CSV export are all part of the Hunter plan. If you are on a Free or Basic plan you will be invited to upgrade when you try to open it.
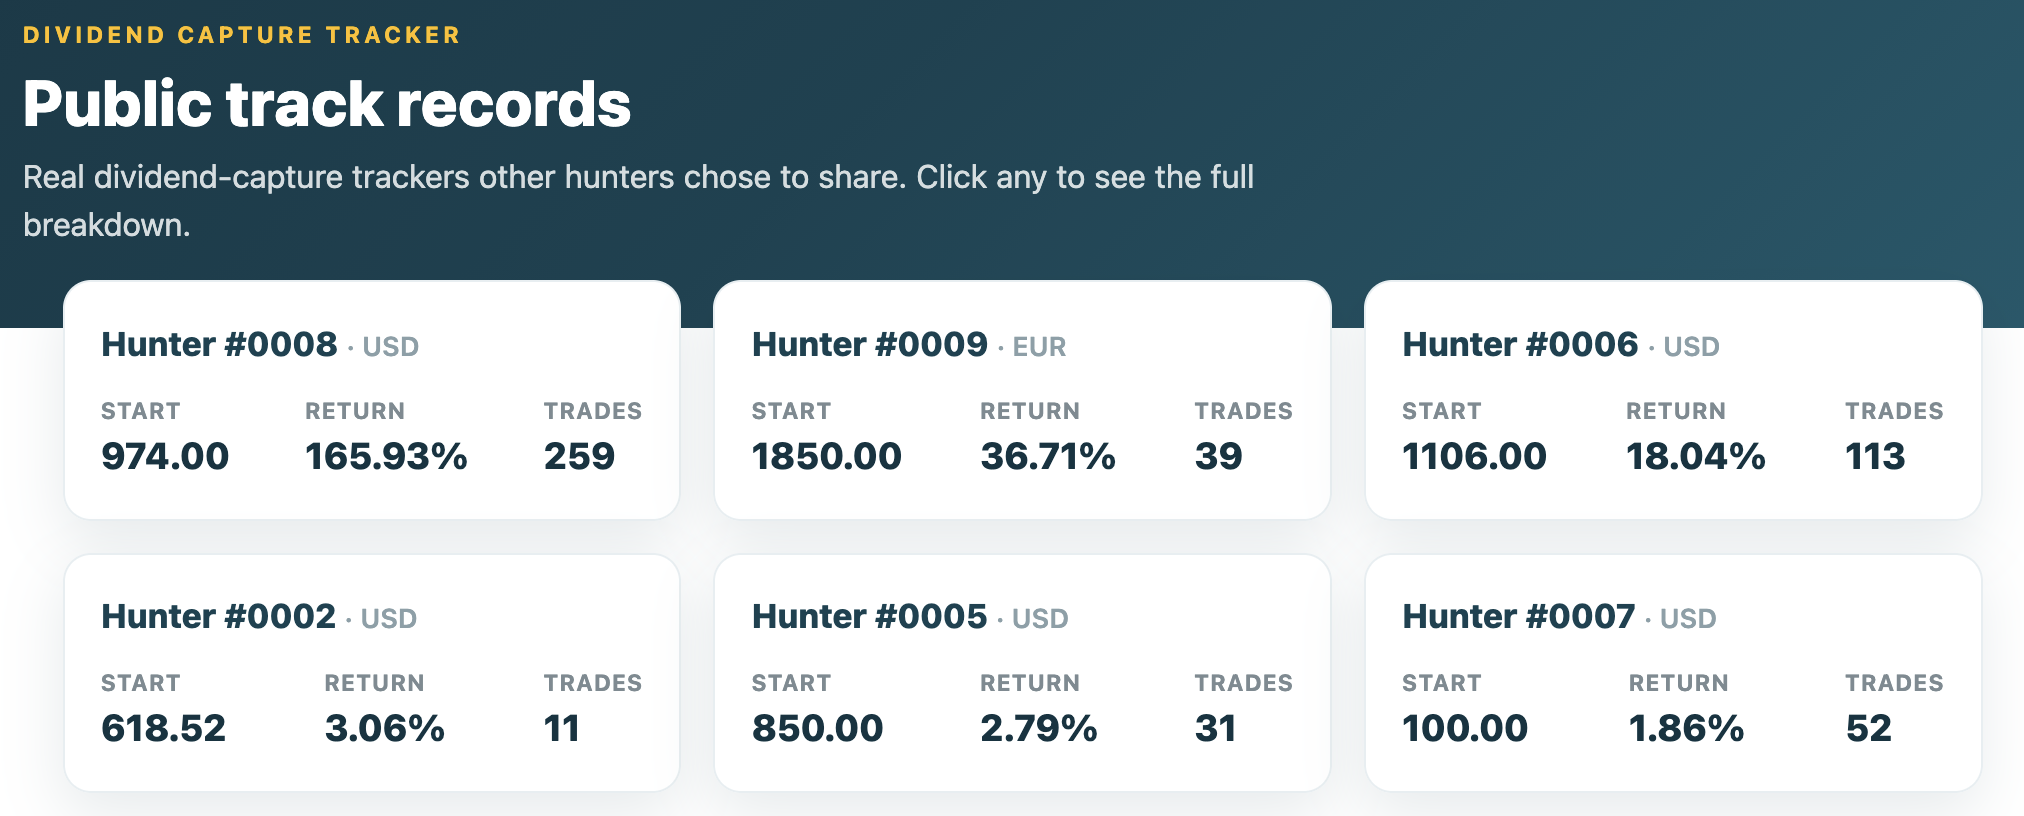
The public dividend trackers, on the other hand, are open to any registered user. Even without Hunter you can browse the records that other hunters have chosen to share and see how real people are actually performing, not a marketing highlight reel. It is one of the most honest ways to judge the strategy before committing to it.
Getting started
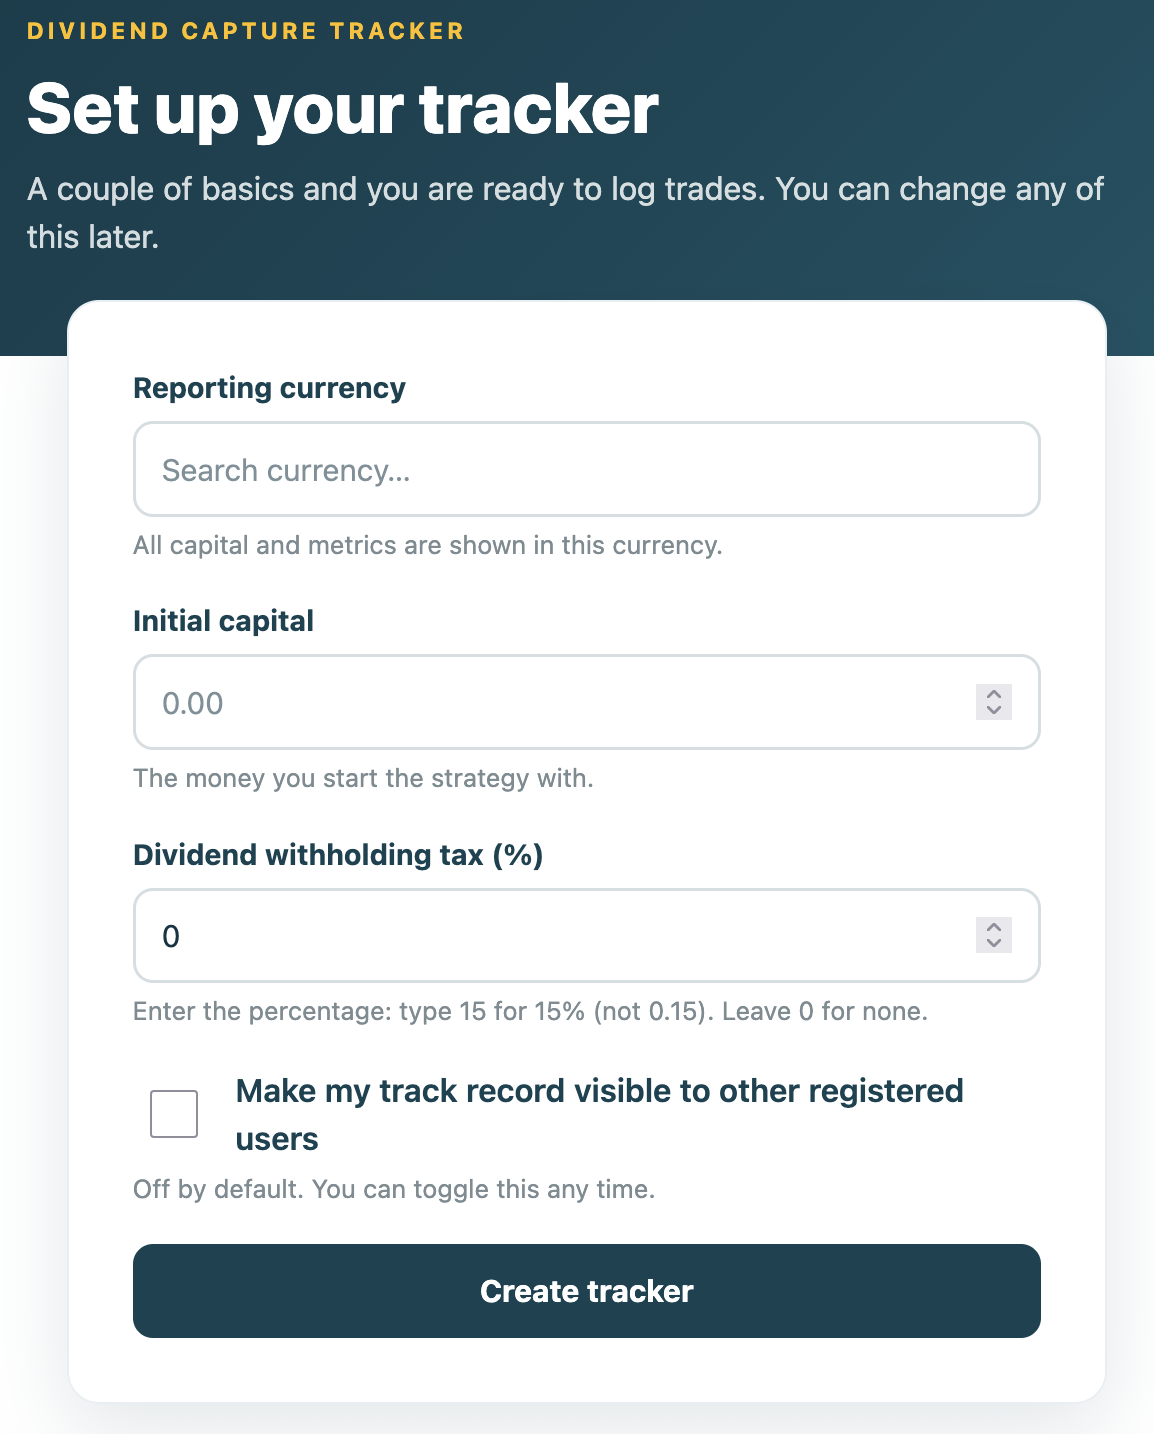
If you are on Hunter, open the tracker from your dashboard, set your starting capital, your reporting currency and your withholding tax rate, and log your first trade. If you are not on Hunter yet, you can still browse the public track records for free, or upgrade to Hunter to start keeping your own.
The tracker is a record-keeping and education tool. It is not financial or tax advice. For your annual return, check the figures against your broker statements and speak to a qualified adviser if you are unsure.

